Way of riding and measuring
I always use full throttle (maximum possible engine power output provided) on my Carver electric surfboard and I always record my riding with a Garmin watch. The watch records many data such as current and average speed, driving time, riding distance, distance from the starting point, heart rate, etc.
A typical course of one of my riding is shown in Fig. 1. It can be seen from the speed chart that with a total ride time of about 15 minutes, the battery starts to soften after about 12 minutes, ie it is no longer able to deliver the necessary power and the surf begins to slow down.
Fig. 1 Riding Speed Chart
With regard to the careful handling of the battery, I always move around the starting point at the end of the ride and immediately head to the shore when the battery indicator turns red (ie the last 20% of the battery capacity starts to draw). The riding time in this red mode usually does not exceed 30 seconds. Most of my rides are under these conditions, so I decided to use the results of these measurements to determine a real decrease in battery capacity depending on the number of charge cycles = number of rides made.
Processing measurement results
I created a software that displays measured data from individual trips recorded in a simple Excel spreadsheet (* .csv file in STARTDATE; STARTTIME, RIDELENGTH;) is displayed in a graph that shows the number of charging cycles on the x-axis and on the y-axis the total riding time in minutes. Individual rides are shown in the graph in the form of small red crosses.
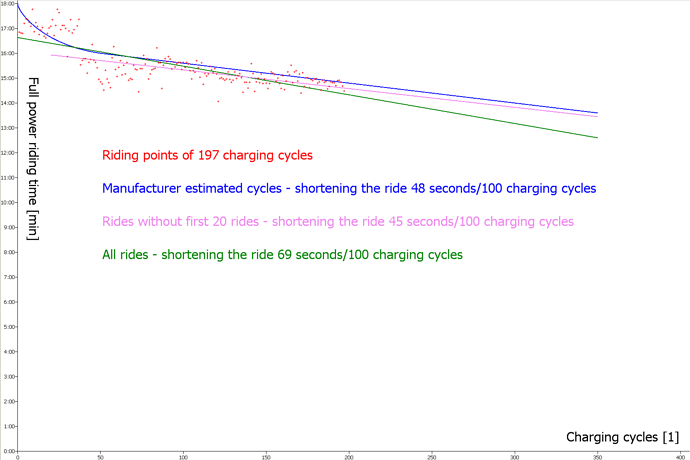
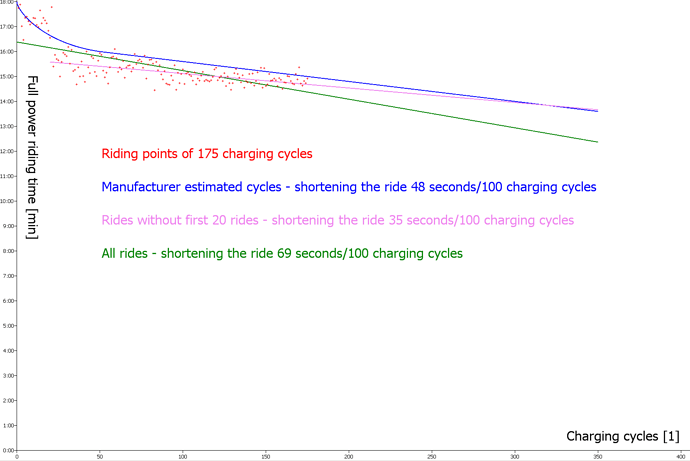
I own two Carver surfboard batteries. I have 197 recharges for one after 2 seasons and 175 recharges for the other. Graphs of both batteries are shown in Fig. 2 and Fig. 3.
Fig. 2 Battery 1 Ride Chart
Fig. 3 Battery 2 Ride Chart
For both batteries, it can be seen from the charts that during the first 20 charges the riding time is between 17 and 18 minutes and then suddenly drops to about 16 minutes and then the drop is even. For both batteries, the same behavior can be seen in the graph.
Expected battery capacity drop
The battery life reported by the surfboard producent is 350 charge cycles. Typically, the life of a lithium battery is when the capacity drops to 80% of the original battery capacity.
For the purposes of the graph, with respect to the length of the first rides, I set the riding time as 18:00 minutes as 100% of the battery capacity.
Thus, the blue line in the graph indicates the theoretical decrease in battery capacity according to the battery life data provided by the manufacturer. Initially, there is an accelerated decrease in battery capacity, then a steady, almost linear decrease in battery capacity, and at the end of battery life, there is an accelerated decrease in battery capacity. However, this section of the graph is not yet displayed in this graph.
Regression analysis of measurements¨
To determine the rate of decrease in battery capacity, I used regression analysis and fitted the regression line with the measured points in two ways. The green line is interlaced with all the measured points and is therefore affected by the accelerated initial drop in battery capacity. The violet line ignores the first 20 rides and approaches the linear part of the theoretical battery capacity curve.
As can be seen from the graphs, I have achieved similar, if not identical, results for both batteries.
Summary
The battery life stated by the manufacturer corresponds to the measured results and can therefore be relied upon. With some caution, riding time under similar conditions as described in the article leads to shorter riding time per battery by about one minute for every 100 charging cycles. Battery capacity will thus be about half after 900 charging cycles, and this is a fairly acceptable number. What will be the reality will show us further measurements in the future.


